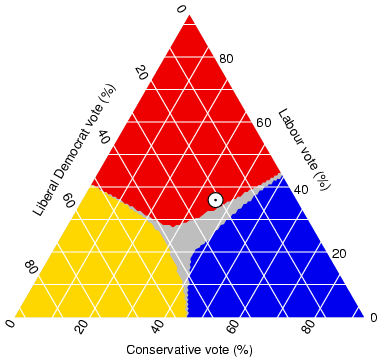
Triangular plots are used to compare three separate variables in order to find similarities and differences in the data. The triangular plot is unique in that the three variable take up a certain portion of the triangle based on their weight. The plot below shows three different voting percentages of particular parties with a grey neutral area and what appears to be mean center for the data marked by the white dot.

http://www.ex-parrot.com/~chris/images/20050407/triangle.png
No comments:
Post a Comment