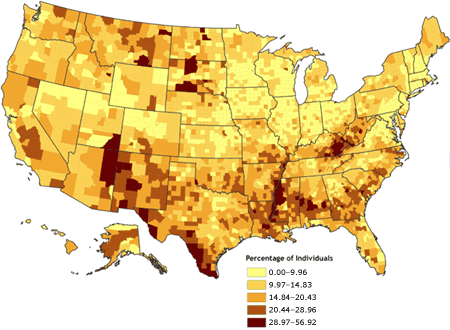
An univariate chloropleth map displays a single variable while using a single symbol or color to represent data. These maps can be used to represent a number of variable from rainfall amounts to population of a given area. Like all chloropleth maps different colors are utilized to represent different amounts of data. The map below uses darker shades of brown to represent higher percentages of people in an area while lighter shades of represent smaller percentages of people.

http://www.cdc.gov/pcd/issues/2007/oct/images/07_0091_01.gif
No comments:
Post a Comment